How to Read an SEO Report
Monthly updates land in client inboxes and the response is usually the same. A quick scroll. Then a glance at the numbers. An email back asking what actually changed and whether any of it matters. The data is all there. Making sense of it, however, is the harder part.
To-The-TOP! has been running SEO in Calgary since 2007. Nineteen years of sending monthly documents, fielding those questions, watching clients go from confused to confident with the same review. This is a plain-language guide to what each section means and where to start.

What the Report Is Actually Telling You
Not one number. Several signals together.
An SEO report draws on multiple sources. Search Console. GA4 data. Rank tracking software. Each one tells part of the story. Together, they also show what actually happened during the reporting period and where problems may be hiding. Understanding all three is what separates a useful monthly review from a collection of charts that get filed and forgotten.
Most providers also pull from a third-party rank tracker alongside Search Console. Search Console shows impressions and clicks. Precise daily positions come from the rank tracker. Together they confirm each other. Differences between them are sometimes the most interesting finding in the whole review.
The executive summary section
Most monthly SEO reports open with a summary section. Read it last, not first. The summary reflects the provider’s read of the figures. Read the raw sections first, then see whether your conclusions match theirs. Differences in interpretation are worth a conversation. Agreement is good. Disagreement is better. It usually surfaces something worth investigating. Nothing stops you cross-checking the numbers yourself, since Google Search Console free SEO monitoring is open to every site owner. Engagement numbers that move without a ranking change usually point to what user experience does to rankings.
What period does this report cover?
Date ranges matter more than most clients expect. Comparing this April to last April tells a different story than April vs. March. Seasonality affects search demand in most industries. A drop in March followed by a recovery in April is often the annual pattern repeating, not a problem being fixed. Ask which comparison the document uses before drawing conclusions from month-over-month swings. Year-over-year is usually more stable and more meaningful.

Organic Traffic: The First Number to Find
Visitors from search. Not all traffic.
Organic traffic counts visitors who arrived through unpaid search results. No direct visits. Paid ads excluded. Just search. It is the primary measure of whether the work is translating into real visitors over time. Most clients focus on organic traffic in the first twelve to eighteen months. That focus makes sense. It is also where progress shows up first.
Sessions, users, and pageviews
Sessions and users and pageviews all appear in monthly reports. Sessions is the number worth tracking month over month. It counts visits. One person can generate multiple sessions. Sessions runs slightly higher than users for that reason. Pageviews inflates on your website when navigation is deep. Rarely the most useful metric of the three for gauging overall progress. For a service business, visits and new users are the two numbers to watch. Time on page and bounce rate add useful context once baseline volume is established.
Where Your Visitors Come From
Organic is the search channel. Direct is visitors typing your URL or arriving from a bookmark. Referral comes from other websites linking in. Social lands from social platforms. A healthy site also has organic as its dominant channel. Usually above 50% within twelve to eighteen months of consistent work. Unusually high direct volume compared to organic sometimes reflects attribution problems in GA4 rather than actual direct visits. Worth checking the source/medium breakdown before assuming anything. Reading a report well starts with the basics of SEO analysis.

Keyword Rankings: Reading Position Data
Position tells you where. Not why.
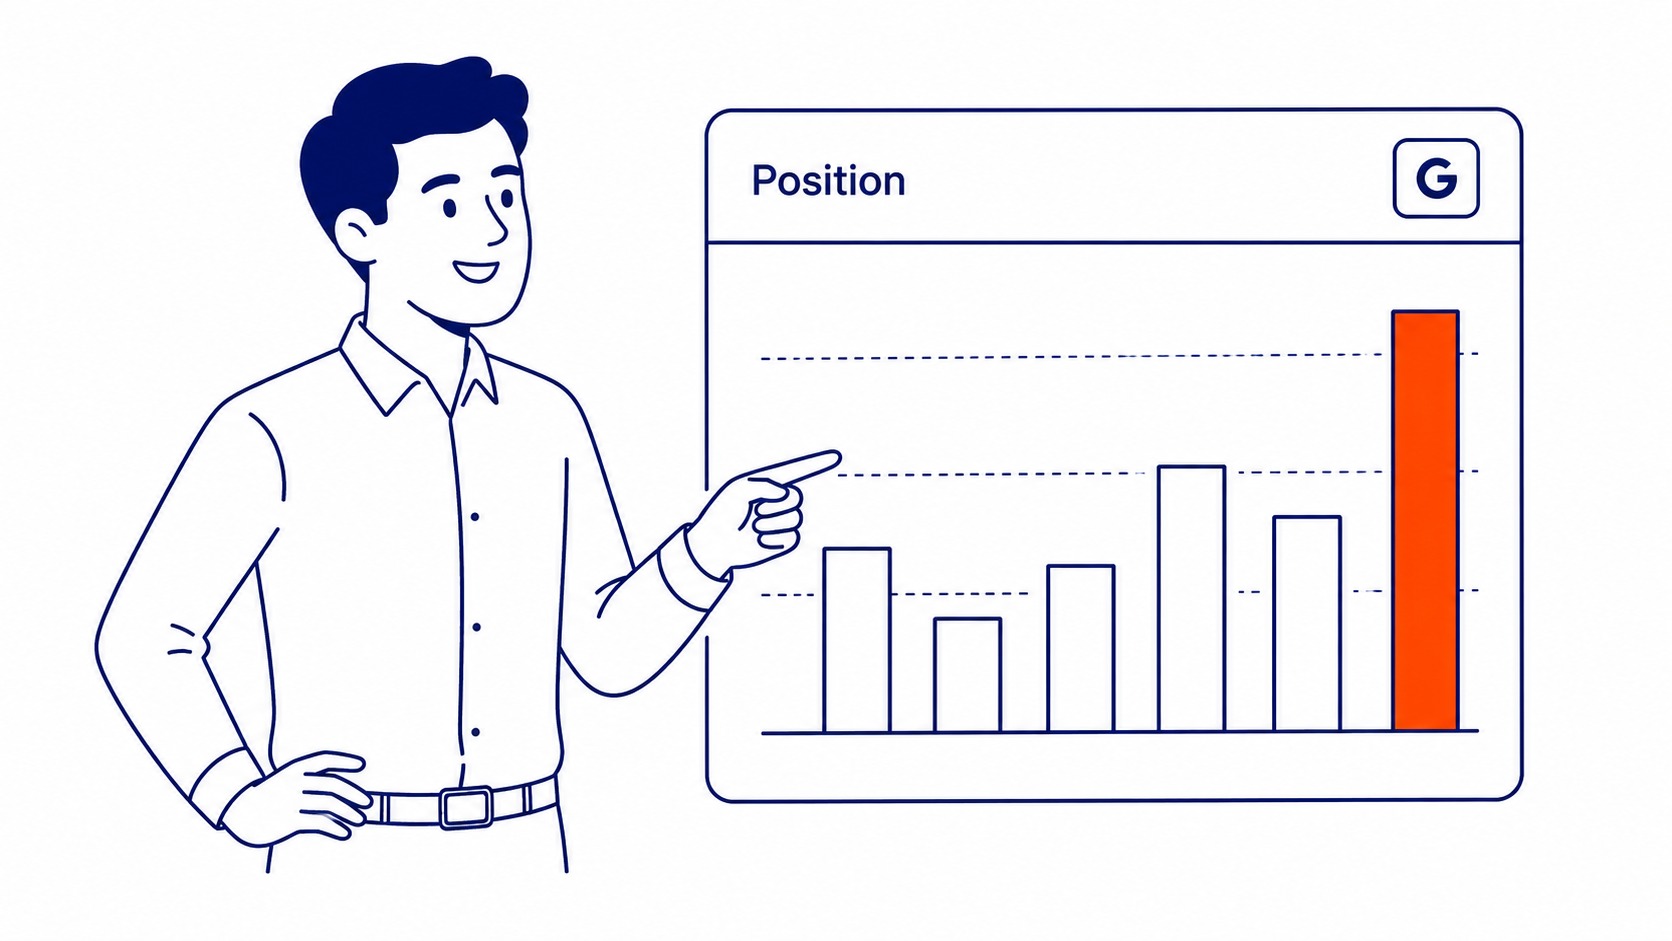
Keyword rankings show where your pages appear in search results. Position 1 through 3 gets the majority of clicks. Anything beyond position 10 is page two. Effectively invisible to most searchers. A move from position 9 to position 5 looks modest on a chart. In visitor terms, it is not. Click-through rate roughly doubles between position 9 and position 3 on most commercial queries. Those movements deserve attention even when the chart does not make them obvious.
Average position in Google Search Console
Search Console reports average position for each query your site appeared for. An average position of 4.7 means your site appeared between fourth and fifth on average across all searches for that term. Push it above position 3. Click-through rate rises quickly once that threshold is crossed. That movement is what our keyword research produces from the start. The right terms matched to the right material before anything gets written. Position figures in Search Console lag a day or two. Recent performance may not yet appear in the document.
Keyword movements: up, down, new
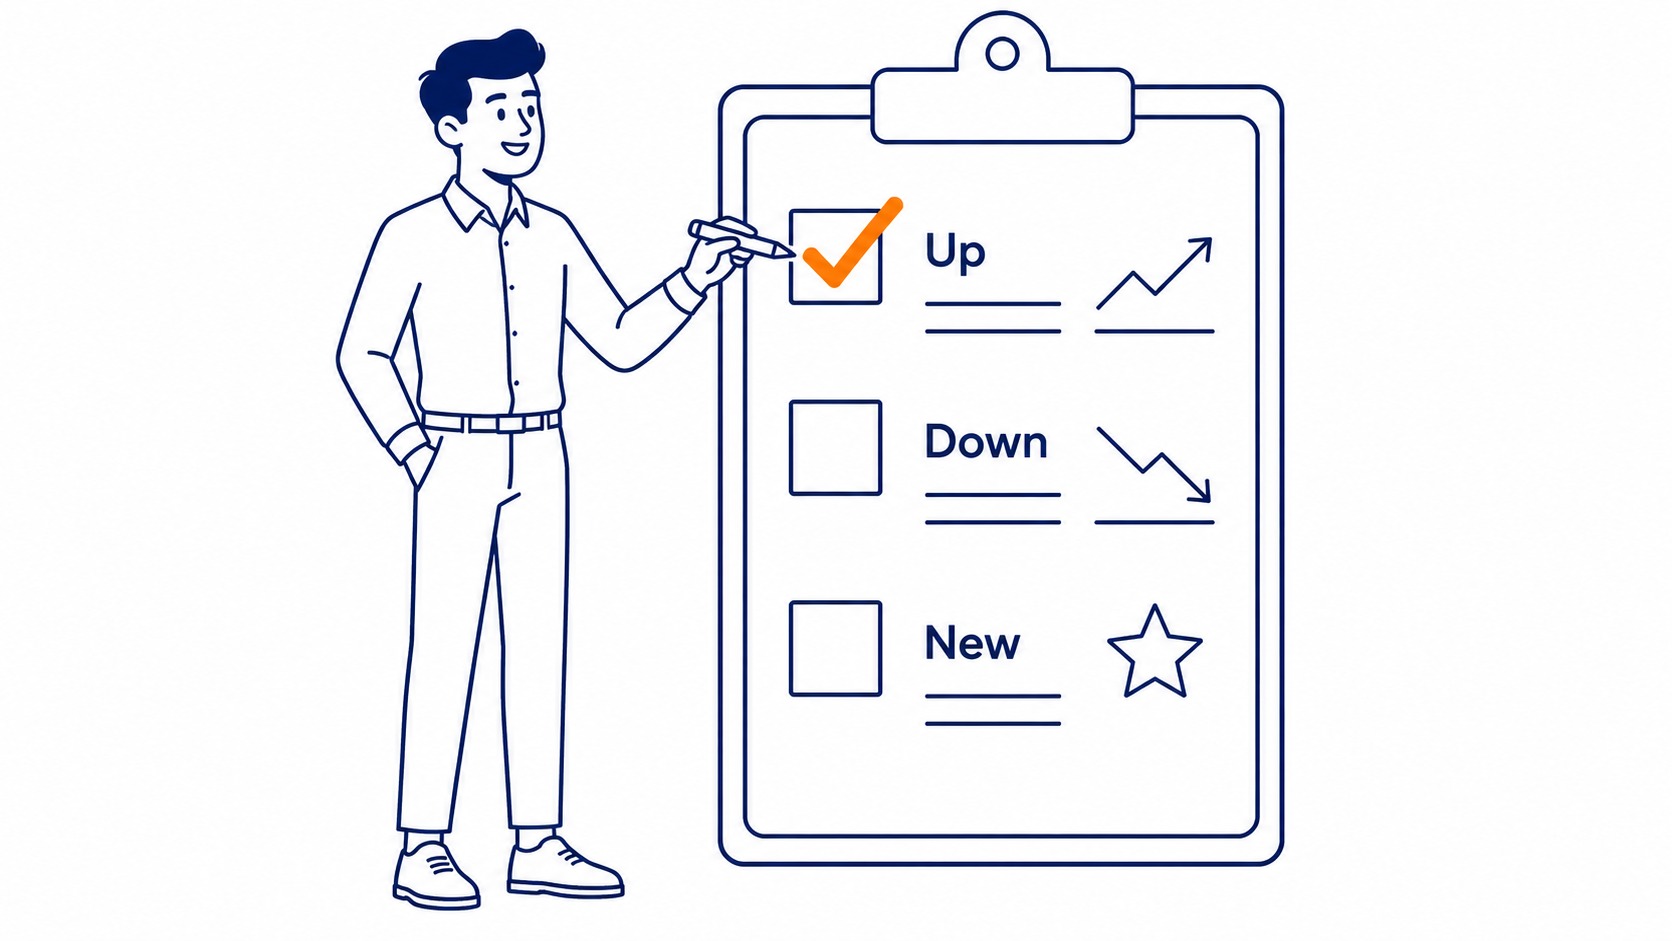
Three movements appear in any ranking review. Positions moving up. Others dropping. Keywords newly appearing. The up column is straightforward. Drop column needs an explanation from whoever manages your site. Positions drop for several reasons. A competitor gained authority. The page lost internal linking support. Google updated how it evaluates content in that category. New keyword appearances often mean a page started ranking for queries it was not specifically targeting. Worth building on, usually. Ask whether any deserve their own page.

Technical Health: Understanding the Issues
Errors you do not see. Still there.
Technical problems live in the background. Crawl errors. Indexing failures. Page speed issues. None of these show up in positions immediately. They accumulate. The cost appears months later. It usually looks like a competitor quietly pulling ahead rather than an obvious problem on your own site.
Crawlability and indexing problems
Search engines crawl your website before they can rank any of it. A page blocked by robots.txt or tagged noindex will not appear in results. Does not matter how well-optimized the copy is otherwise. Crawl problems in a review need to be resolved, not noted and left. It pays to book a website audit and catch these before they compound. Indexing failures, left unattended, quietly remove your website from search results. No obvious signal reaches the site owner. Some businesses run for months without realising key URLs are not indexed at all.
Page speed and Core Web Vitals
Page speed in your SEO report usually appears as Core Web Vitals scores. LCP measures how fast the main content loads. INP measures how quickly the page responds to interaction. CLS measures layout stability as the page renders. Failing any one of these hurts positions on competitive queries. The thresholds are strict. LCP should be under 2.5 seconds. None of these failures are visible to visitors. Easy to overlook for months. Search visibility drops quietly in the meantime.

Backlinks: Reading the Link Section
Links are votes. Some votes count more.
Backlinks point from other websites to yours. The link section of the document tracks how many there are and where they come from. Two numbers appear in most link sections. Total backlinks counts every individual link. Referring domains counts how many unique sites those links come from. The second number matters more. Ten links from ten different sites outweigh ten links from the same one domain. A growing referring domain count over six to twelve months is a good sign. Your website is earning recognition from outside sources.
Not every backlink helps, however. Links from low-quality or irrelevant sites add noise without contributing to position. A well-structured monthly report flags new referring domains. It gives a quality signal alongside the count. Domain authority scores vary by tool. Use one consistently rather than mixing platforms. The trend over twelve months is still more meaningful than any single month’s total.
Link building is a slow process. Referring domain count on a well-maintained site might grow by three to five new domains in a good month. A sudden spike overnight usually means something went wrong, not right. Worth investigating before celebrating.

Conversions: Where Visitors Become Business
Clicks alone are not enough.
Visitor volume and rankings tell half the story. Conversions complete it. A conversion is whatever matters to the business. Phone call bookings. Contact form fills. Online purchases. Monthly reporting connects ranking activity to those outcomes. A review that shows only positions and visitor counts, without conversion data, is missing the information that business owners need to make decisions.
How conversions connect to rankings
Rankings improve first. More searchers see the page. Click-through rate rises. Organic visits follow. Conversions come last in the sequence. The timing gap is normal, however. Visitor volume often rises two to three months before conversions catch up in meaningful numbers. New visitors on service-based websites usually need two or three touchpoints before converting. Clicks that come through our Google Ads management can convert on the first visit. Organic search builds familiarity over multiple visits. That lag is not a failure. It is how organic search works.
What to Ask After the Monthly Review
Numbers answered. Questions still open.
A good report raises questions. That is the point. The figures show what happened. Whoever manages the work should explain why and what is coming next. A review that is mostly charts without a narrative says something. Not just about site performance. About how the work is being managed. Push for analysis, not just metrics.
Three questions worth raising after any monthly report. What moved and why? Which areas dropped and what is the plan? What should the next sixty days focus on? The answers tell you as much about your specialist as any chart in the document. Good SEO services include that narrative layer as a baseline. A provider who cannot explain a position drop after six months of managing the account has a problem. Worth knowing that before signing off on another month.
Frequently Asked Questions
What does an SEO report look like?
Format varies by provider. Most monthly reports run several pages. Traffic trends. Keyword movements. Technical health flags. Backlink counts. Notes from the specialist. Some providers send a PDF export. Others share a live dashboard link. The underlying data should come from Search Console and GA4 regardless of format. Automated report generators exist and are widely used. Narrative analysis still needs to come from a person. Someone who understands what the figures mean for that specific site.
What is the 80/20 rule in search?
The 80/20 observation holds in most sites we work on. A handful of pages drive the majority of organic visits. Usually fewer than clients expect. One or two pages doing most of the heavy lifting. The rest contributing a fraction. Worth identifying which ones they are before making any significant site changes. Redesigns. Migrations. URL restructuring. All have a way of erasing years of built-up position. Those pages at the top of the organic visits list are the ones to protect first.
Is 75 a good audit score?
Depends entirely on the tool. Audit scores are proprietary. SEMrush calculates its own score. Moz uses a different formula entirely. Neither measures the same factors. A 75 on one platform is not the same as a 75 on another. Track the trend within one tool over time rather than comparing across platforms. What matters is whether the score is moving in the right direction. Also whether the underlying issues being flagged are actually getting fixed.
Is SEO dead or evolving in 2026?
Still evolving. Search behaviour has shifted. More AI-assisted answers appearing in results. Zero-click results increasing in some categories. Featured snippets more prevalent than five years ago. The underlying signals have not changed, however. Page authority. Content depth. Technical health. Backlinks. Those factors still drive which content gets cited and ranked. That question reappears every few years. Has not been right yet. Methods evolve. The fundamentals hold.
Contact Calgary SEO Company To-The-TOP!
Questions about anything in this article, or about your own rankings? Talk to a Calgary SEO specialist directly.
Phone: (403) 308-5949
Address: 1509 14 Ave SW, Calgary, AB T3C 0W4
Hours:
Monday to Friday: 10:00 am – 7:00 pm
Saturday: 12:00 pm – 4:00 pm
Sunday: closed