What SEO KPIs Should You Track?
Most business owners come to us with a dashboard full of numbers. Impression counts. Session totals. Bounce rate. Domain authority. Pages per session. The list runs long, and not all of it is worth watching.
We have been running local SEO Calgary campaigns since 2007. Edmonton and Vancouver are in the mix too. Nineteen years of client work. The KPIs that actually shape decisions are fewer than most SEO reports suggest. Traffic quality beats traffic volume. Conversions tell you more than rankings. A metric that cannot influence a next action is not worth tracking weekly.
One more thing before the list. Not every business needs to track every KPI below. A local Calgary trades company running SEO alongside our Google Ads management has different tracking priorities than an e-commerce store. The KPIs worth watching depend on what the business sells and how sales happen.
The KPIs Worth Your Attention
Most can be ignored.
Key performance indicators, in an SEO context, are the subset of metrics tied directly to business outcomes. Organic visitors arriving through search. Keywords moving toward page one. Conversions from those visitors. Return on investment over time. Everything else is either a proxy for one of those or a vanity metric that fills a report without changing a decision.
Start with the smallest list that still tells you whether your SEO efforts are paying off.
Organic Traffic: The Number That Anchors Everything
Start here. Everything else is context.
Organic traffic counts how many visitors landed on your website through unpaid search results. No ad spend behind it. Each one clicked because your page appeared for a query they ran.
In GA4 (Google Analytics 4), find it under Acquisition. Filter by organic search channel. What matters is the monthly trend, not the weekly number. Week-to-week shifts are noise. Seasonal patterns and crawl timing both introduce short-term movement that disappears within days. Monthly trending tells you whether the channel is actually growing.
One thing distorts organic traffic totals. Branded search. Someone searching your company name directly inflates the count. Strip it out. Segment non-branded organic traffic separately in your reporting setup. That is the portion where SEO keyword research and on-page SEO efforts produce measurable gains.
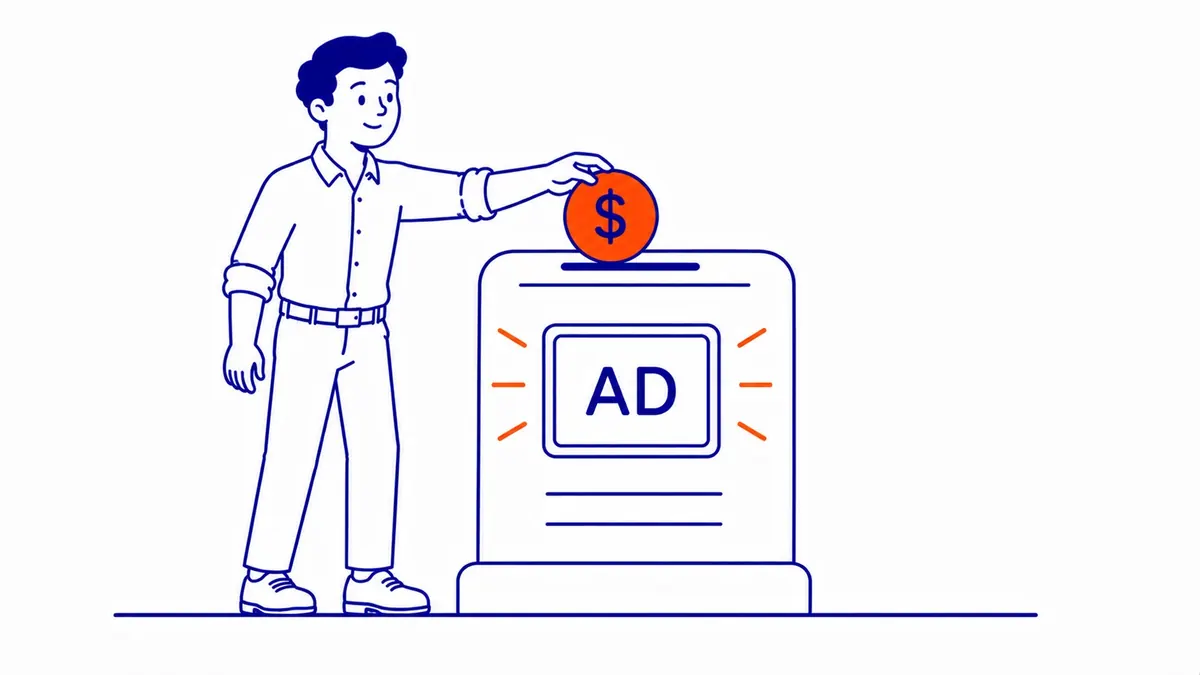
Organic vs Total Traffic
One tells you size. The other tells you reach.
Total site traffic includes every channel, not just search. Direct visits and email referrals land in the same count as organic. Organic share of total traffic tells you whether SEO is growing as a channel. Or whether other sources are still carrying most of the load. Track it as a ratio over twelve months. Ratios like that make more sense with traffic in SEO explained first.
Keyword Rankings: Visibility Before Clicks
Rankings confirm the work. They do not confirm the value.
Where your pages rank for target keywords determines whether they earn impressions at all. Page one for a relevant keyword generates traffic. Two rarely does anything useful. The move from position 11 to position 6 often doubles click volume without any content changes. Just the ranking shift alone.
Google Search Console tracks this under the Performance report. Pull individual keyword data rather than the aggregate average. Average position across a whole site masks which keywords are climbing and which are stuck. Semrush and Ahrefs both offer daily position tracking at the keyword level. A monthly ranking review is enough for most campaigns, however. Weekly tracking creates anxiety more than insight.

Average Position in Search Console
Average position hides individual keyword movement.
A site averaging position 8 across 200 tracked keywords could have its top keywords anywhere between position 2 and position 45. Monthly keyword-level reports surface what is actually moving. That is where you find which content is responding to recent algorithm updates and which pages need another pass.
Branded vs Non-Branded Traffic
Branded traffic confirms awareness. Non-branded confirms SEO reach.
Someone searching your business name specifically is already aware of you. Non-branded organic visitors found your site without knowing who you are. A searcher typing “SEO services Calgary” and clicking your result is exactly where keyword research investment shows up. Track both separately. Non-branded growth is the metric that justifies the budget.
Click-Through Rate and Impressions
Impressions count visits to the listing. Clicks confirm it worked.
CTR is the percentage of search impressions that became an actual click. A page earning 1,000 impressions monthly but only 20 clicks has a 2% click-through rate. Average CTR at position one runs around 27-28%. That number is from Search Console data averaged across industries. At position five, it drops closer to 7%. Below position ten, under 3%.
High impressions with low CTR usually points to a title tag or meta description problem. The page is ranking. That listing, however, is not convincing searchers to click. Rewriting the title to match search intent often lifts CTR without touching the underlying content. Run the test in Search Console. Compare CTR before and after.

What Reasonable CTR Looks Like by Position
Position one still misses most searchers.
Position one averages 27-28% CTR across all query types. Three runs around 10%. Ten sits under 3%. Branded queries convert clicks at higher rates than informational queries. Navigational queries sit highest of all. The industry averages are a benchmark for setting expectations, not a floor to celebrate.
Bounce Rate and Engagement Metrics
Context is everything with this one.
Bounce rate measures how many visitors left after viewing only one page on your site. High bounce rate on a blog post where the visitor read everything and left satisfied is not a problem. A service page where visitors leave within ten seconds, however, usually is.
GA4 replaced the traditional bounce rate with engagement rate, the inverse metric. An engaged session is one lasting over 10 seconds. Visiting more than one page also qualifies. So does triggering a conversion event. Average engagement time per user adds nuance that bounce rate never could.
Check engagement time by page under Reports, then Engagement, then Pages and screens. Pages with high traffic but under 30 seconds average engagement time are candidates for content quality review. Lower-traffic pages holding over 90 seconds engagement are still doing meaningful work regardless of the bounce number.

Average Engagement Time per Session
GA4 calls it average engagement time. Watch it per page.
Sort the Pages and screens report by average engagement time. The pages doing real work show up immediately. A page with 90-second average engagement and single-page visits delivered value regardless of what the bounce rate says. The 12-second average engagement page with strong traffic is the problem to investigate first. What bounce rate in SEO actually measures is worth pinning down before acting on either number.
Conversions: The KPI That Justifies the Budget
Everything else is upstream of this one.
An organic conversion is a search visitor who completed a desired action on your website. A contact form submission. Phone call click-throughs. Completed purchases. This is the metric that ties SEO directly to revenue. Most businesses undertrack it in the first year.
Conversion tracking requires deliberate setup in GA4. Each conversion event needs to be defined and configured before it starts recording. Without that setup, reporting shows traffic and engagement data but nothing about actual results. Getting conversion tracking live early matters more than almost any other configuration step.
Conversion rate from organic search, conversions divided by organic sessions, is also the ratio worth watching monthly. Strong conversion rates on moderate traffic often outperform high traffic that never acts. Quality of visitors matters as much as volume.

Organic Conversions vs Total Conversions
Organic conversion rate sits apart from paid or direct.
A business running both SEO and Google Ads management needs each channel’s conversions tracked separately. Organic often converts at a different rate than paid search. Knowing which landing pages drive organic conversions tells you where to build content next. Existing pages that hold traffic but convert poorly are also surfaced this way.
Backlinks and Referring Domains
Referring domains matter more than total link count.
Backlinks are links from other websites pointing to your pages. They remain a significant ranking factor. Total link count is less important than the number of unique domains linking in. A hundred links from one site carry far less weight than twenty-five links from twenty-five different sites.
Also track referring domain growth in Ahrefs or SEMrush. Look for steady month-over-month increases. Watch for sudden drops, which can signal lost links or an algorithmic penalty. Domain authority from Moz and domain rating from Ahrefs give context on link quality. Neither is a direct Google ranking signal, however. They are proxies for what Google measures independently.

SEO ROI: The Metric Clients Actually Care About
Traffic is an input. Revenue is what matters.
SEO ROI measures the return from search engine optimization work against what was spent. The rough calculation is organic revenue generated, minus SEO costs, divided by SEO costs. Express it as a percentage. Most businesses cannot attribute revenue directly to organic search without proper conversion tracking in place. Revenue values also need to be assigned to each conversion event.
Building accurate SEO ROI tracking takes time. Attribution windows need to be realistic. Most Calgary SEO campaigns take three to six months before ROI becomes calculable from the data. That is the realistic timeline. A reasonable benchmark for established campaigns. Businesses with proper tracking often see two to four dollars in attributed organic revenue for every dollar spent on an SEO services agency in Calgary. Within twelve months. Getting to that calculation requires the infrastructure to exist first.

Metrics Worth Deprioritising
Not everything in the dashboard is a KPI.
Some metrics exist because they are easy to measure, not because they signal meaningful progress. Social shares on blog content. Total impressions without filtering by position or keyword. Raw keyword count without search volume context. Page views without segmenting by traffic source. These surface in most dashboards and consume reporting time without influencing decisions.
Vanity metrics are the ones that make the numbers look healthy while the campaign stays flat. Impressions climb when you rank for low-volume terms with almost no competition. Pages per session rise when navigation is confusing. Time on site goes up when content is hard to scan. None of those movements are SEO progress.
Still, test any metric before tracking it regularly. Does a change in this number tell us to do something differently? If not, it is not a KPI. It is a background number. Stop tracking it weekly. The full list of SEO metrics worth tracking is shorter than most dashboards suggest.
Tools for Tracking SEO KPIs
Three cover most of what you actually need.
Google Search Console is free and pulls directly from Google’s index. Organic clicks. Search impressions. Average position. Click-through rate. It is the starting point for any SEO reporting setup and the most reliable source for keyword-level data.
GA4 tracks on-site behaviour. Active users. Session counts. Engagement time. Organic conversions. Also free. The setup matters more than the platform itself. Without conversion events configured, GA4 shows traffic data but nothing actionable about what that traffic is actually doing.
Ahrefs and SEMrush both offer paid keyword rank tracking. Backlink monitoring as well. Search visibility reporting across competitors. SEMrush covers broader surface area across channels. Ahrefs is preferred for backlink accuracy by most practitioners. Either works.
For client reporting at SEO Company To-The-TOP!, we pull from all three. Search Console for rankings and CTR. GA4 for traffic and conversions. Ahrefs for referring domain growth. Monthly review cadence. No more than one hour of reporting time per client per month.
Worth running a proper SEO audit before building any tracking framework. An audit surfaces what is already working. What is technically broken. Which KPIs matter most for that specific site. Starting with a baseline makes the monthly numbers meaningful from day one.
FAQ: SEO KPI Questions Worth Answering
Questions we hear regularly about tracking SEO KPIs.
What KPIs to consider for SEO?
Organic traffic. Keyword rankings. Click-through rate. Bounce rate by page. Conversions from search visits. Referring domain growth. Those six cover the range from early visibility to actual revenue. Not all of them matter equally at every stage of an SEO campaign. Traffic and rankings matter early. Conversions and ROI matter once traffic volume is established.
What are examples of KPI for SEO?
Organic sessions per month from GA4. Average keyword position in Google Search Console. Click-through rate from search listings. Bounce rate and average engagement time by page. Conversion rate from organic visitors specifically. Referring domain count month over month from Ahrefs or SEMrush. Those show up in every well-built SEO report worth reading.
What is the 80/20 rule for SEO?
Applied to KPIs, roughly 20% of tracked metrics drive 80% of useful decisions. Organic traffic and conversions together account for most of those decisions. Domain authority scores support those two. Raw impression counts do as well. Page speed benchmarks. Core Web Vitals. None of them replace organic traffic or conversions as the primary KPIs. Track everything briefly each month. Focus reporting attention on the top two or three numbers that change what you do next.
Which SEO metrics are important to track?
Organic traffic and conversion rate from organic visits are the two most important. Rankings confirm whether pages are moving toward real visibility in search results. Backlink growth confirms whether site authority is building over time. Bounce rate and average engagement time confirm whether arriving visitors are actually finding what they searched for. Start with those five. Add others as your reporting setup matures.
Contact Calgary SEO Company To-The-TOP!
Questions about anything in this article, or about your own rankings? Talk to a Calgary SEO specialist directly.
Phone: (403) 308-5949
Address: 1509 14 Ave SW, Calgary, AB T3C 0W4
Hours:
Monday to Friday: 10:00 am – 7:00 pm
Saturday: 12:00 pm – 4:00 pm
Sunday: closed