What Is a Good Conversion Rate for Google Ads?
We pull monthly Google Ads reports for clients across Calgary. One question surfaces every time: is this number good. Straight answer depends on context. Not on a single industry benchmark.
Industry matters. Campaign type matters. What counts as a conversion matters most of all.

The Benchmark Number and Why It Misleads
Worth scrutinizing before you trust it.
The 3.75% figure appears in almost every article on this topic. It represents the average across all industries on search campaigns. WordStream aggregated it from tens of thousands of advertiser accounts. Legitimate data set. Used incorrectly all the time.
That figure averages together industries that behave nothing alike. Legal services and home renovation both land in that sample. So do SaaS trials and emergency plumbing calls. An aggregate mean smooths over those differences entirely.
Applying it to your own account has a problem. The denominator is too wide. It is like comparing your restaurant revenue to the national average for all food service. The industries in that average are not yours.
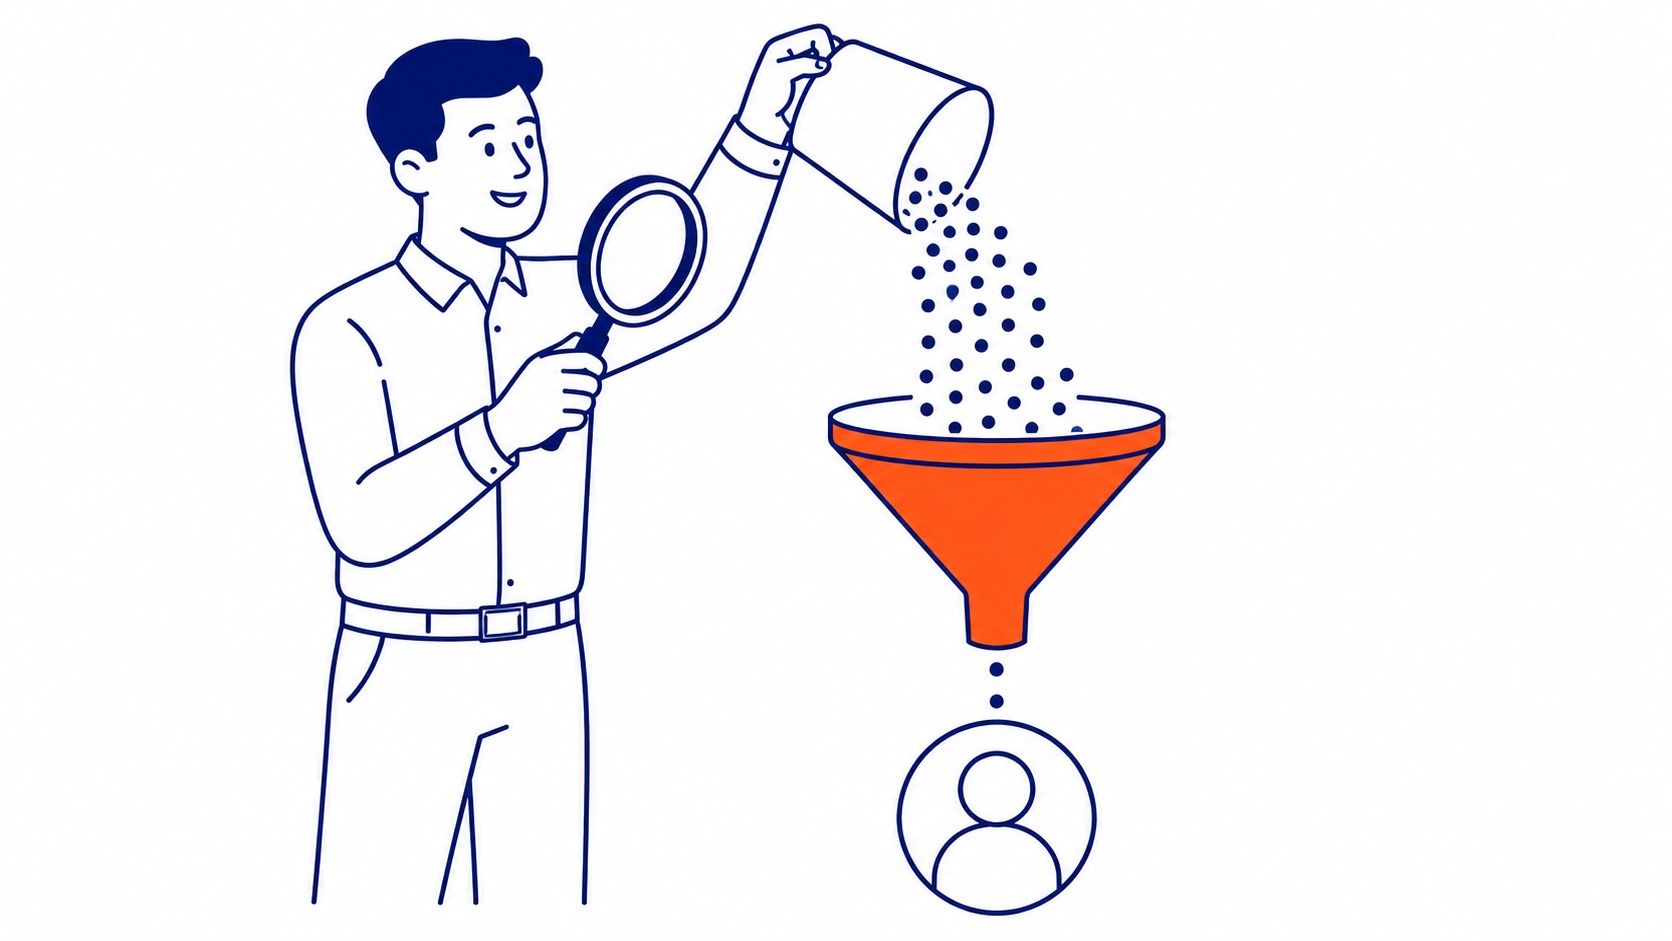
A more useful question is how your sector typically performs. Then, whether your own numbers move in the right direction month over month. Tracking your conversion rate against your own prior months is more informative than comparing it to a cross-industry average. A trend line you own is worth more than a benchmark borrowed from a different industry.
How Google Ads Conversion Rate Is Calculated
Straightforward math. Harder interpretation.
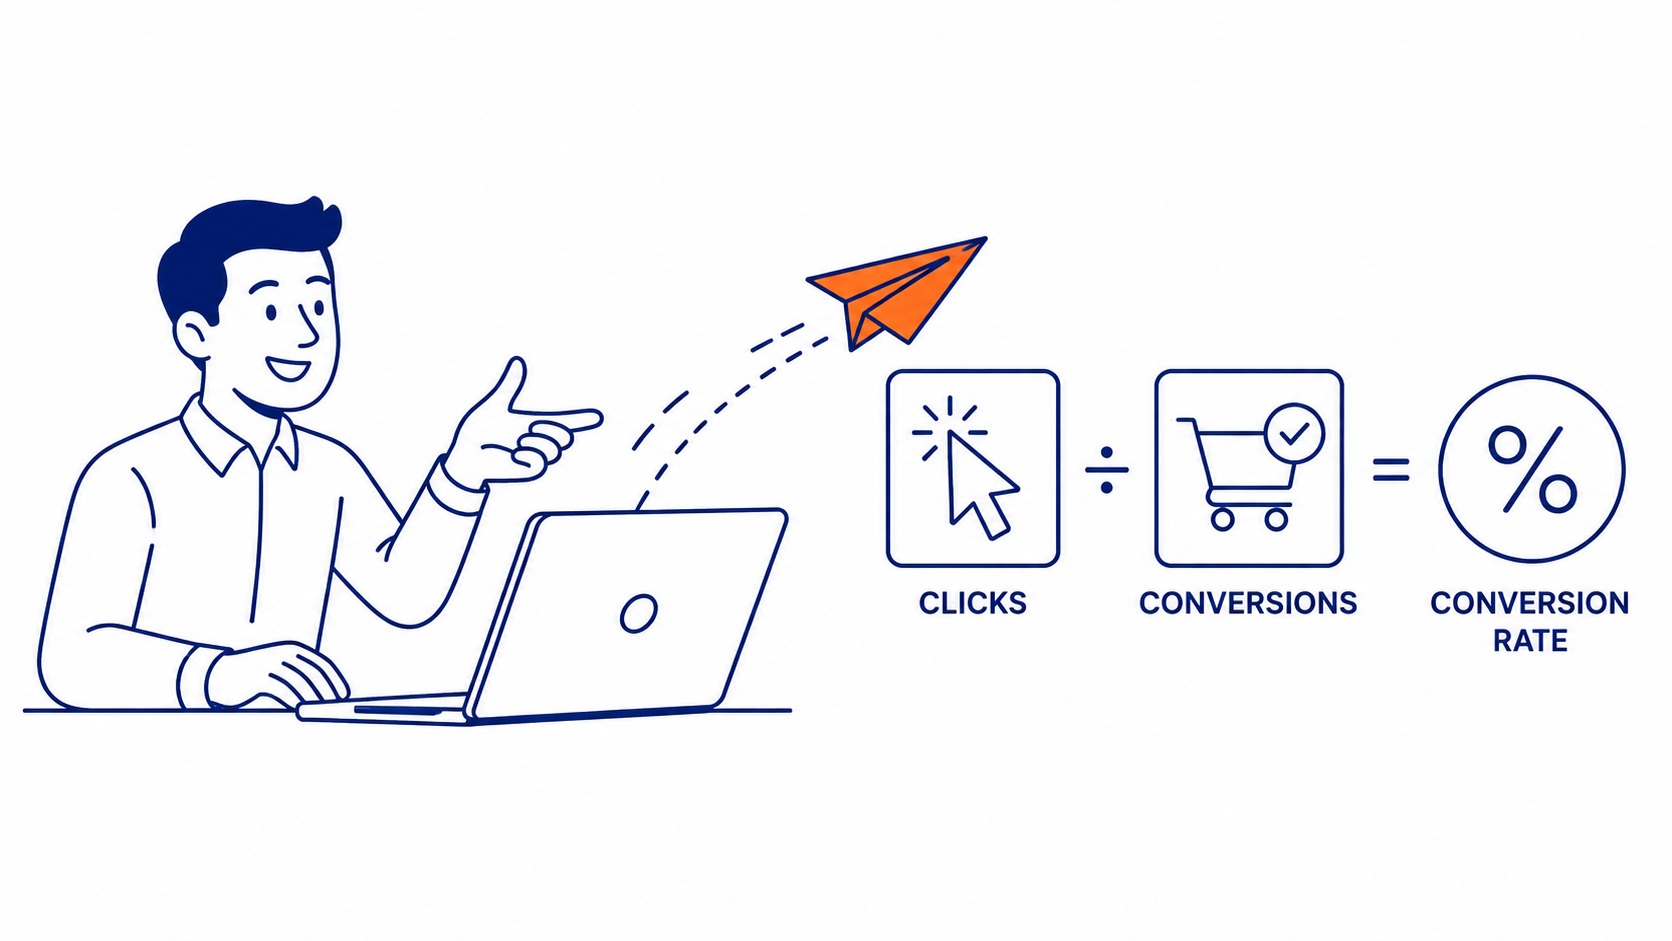
Conversions divided by clicks, multiplied by 100. That gives the percentage. An ad receives 300 clicks. Twenty-one people book a call. CVR is 7%.
The denominator is where most accounts run into problems, however.
Not every click carries purchase intent. Broad match keywords pull in research queries alongside buying queries. Display ads reach people who were never searching for anything at all. Both reduce your rate without the campaign being a failure.
What the formula cannot tell you is whether the conversions you are counting are worth counting. We see accounts where the rate looks strong. The sales team reports cold leads. Usually micro-conversions are being logged alongside genuine buyers. Page views counted as conversions. PDF downloads counted as conversions. Soft CTA clicks counted as conversions. That inflates the rate without reflecting revenue.
Know what you are tracking before you draw conclusions from the number.
Industry Benchmarks: A Realistic Range
Each sector lands differently.
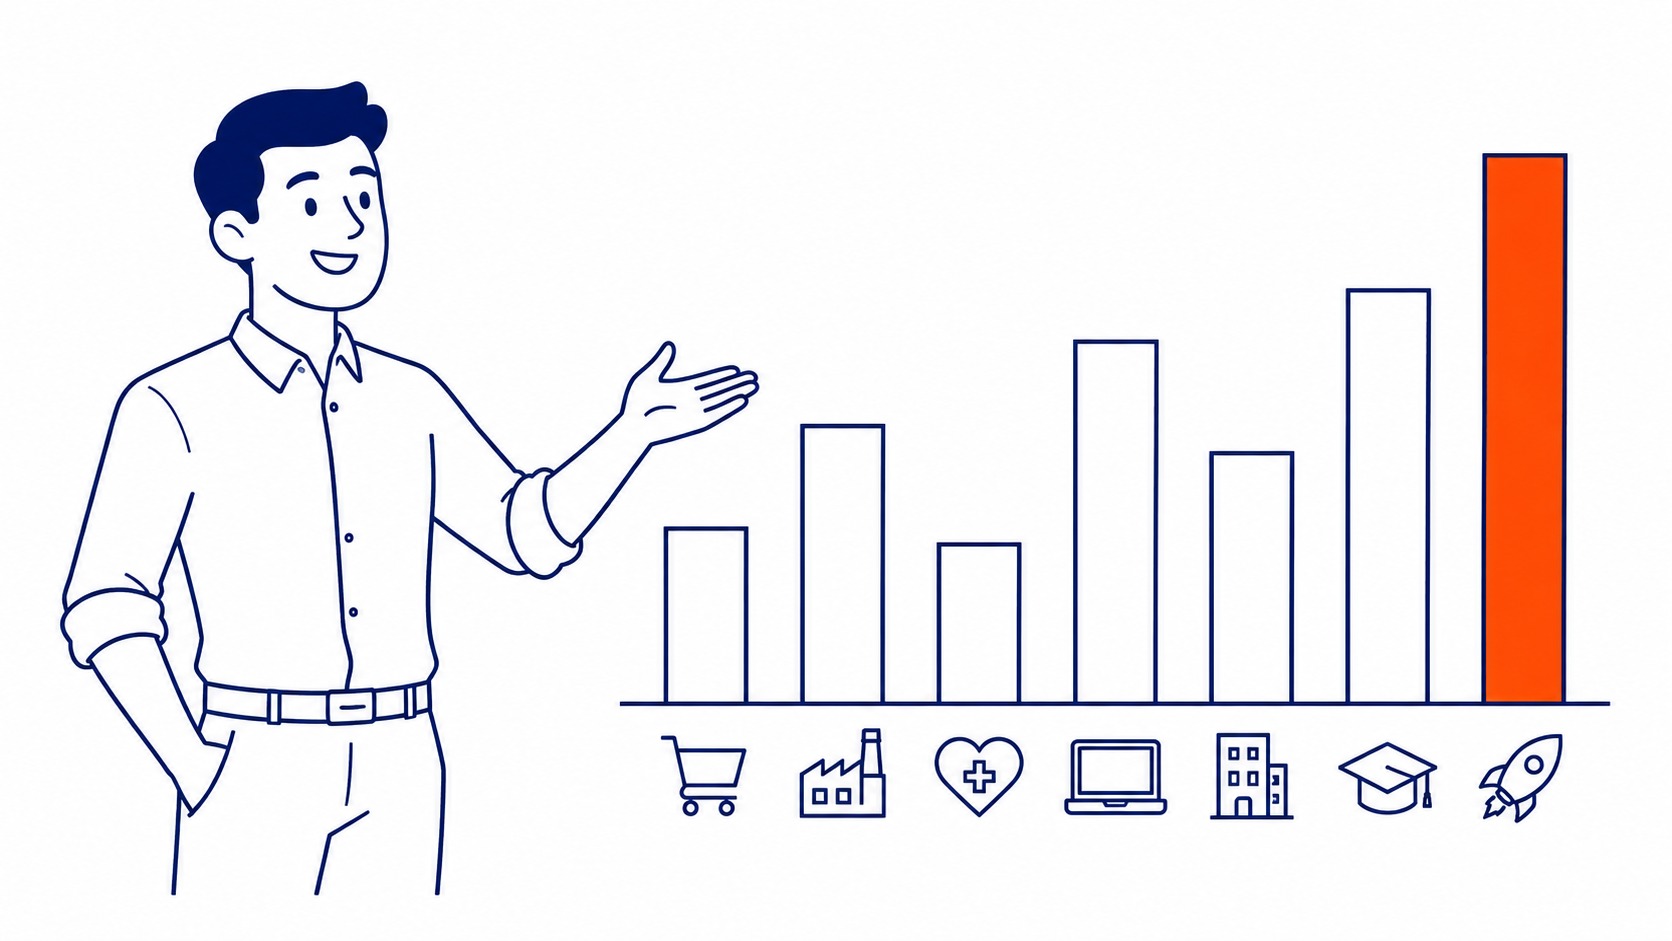
E-commerce on search ads typically runs between 1% and 4%. Legal services often sits under 2%. Healthcare queries for elective procedures sometimes push above 10%, because searchers arrive already further along in their decision process.
Home services and trades occupy the middle ground. Around 3% to 6% for well-managed search campaigns is what most accounts in those categories see. That range shifts depending on how tightly keywords are targeted. Landing page quality also drives it considerably.
Display ads operate on a different baseline. 1.8% is often cited as a solid display benchmark. Many accounts run below that. Display builds awareness and remarketing audiences. Measuring display by the same standard as search ads misses why it is in the budget.
Finance products vary widely. Decisions are high-ticket. Consideration cycles run long. Searchers compare options before clicking. All of that pushes conversion rates down even when the campaign itself is well built.
The number worth benchmarking against is what similar businesses in your specific category see. Not the aggregate mean. Those are two different conversations. Same rule holds for click-through rate, where good CTR depends entirely on the vertical.
What Counts as a Conversion Changes Everything
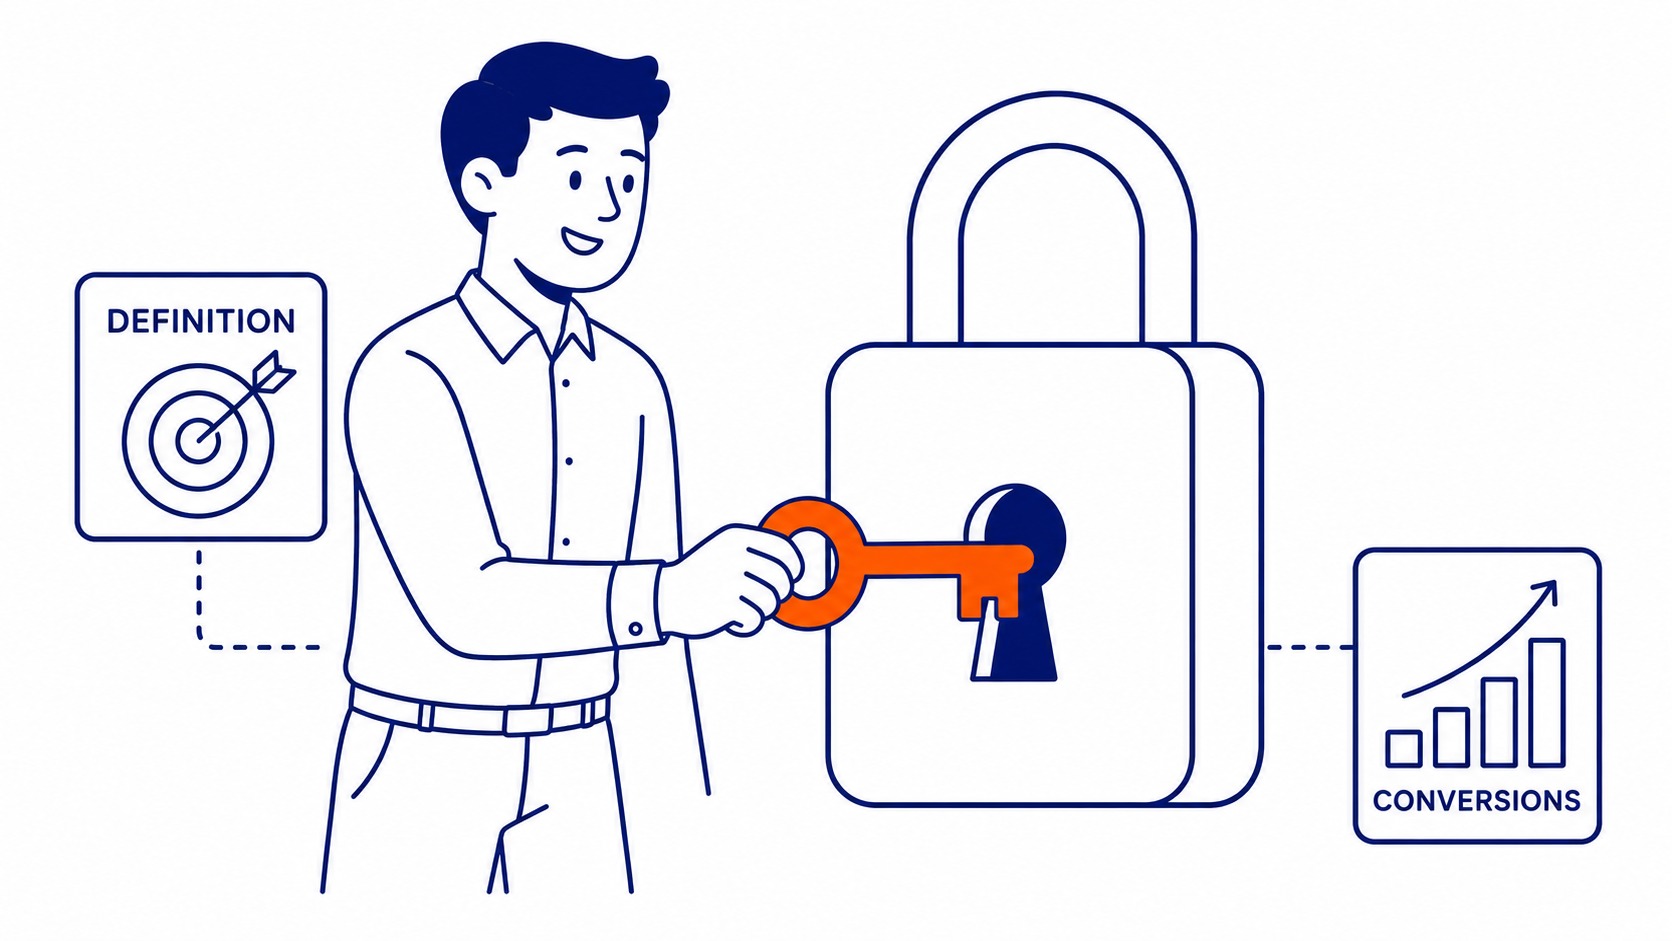
Definition drives the number.
Phone calls logged through call tracking count as conversions. Purchase confirmation pages count. Form submissions count. Chat initiations count. Calendar bookings count. All of these can be set up as conversion events in your account.
But these are not equivalent outcomes.
That call from a buyer comparing two local plumbers is a warmer lead. A form fill from someone at the start of research is not the same thing. Both register as one conversion in the data. If you are only looking at that single metric, you cannot tell them apart without pulling CRM records or listening to calls.
We see accounts where the rate shows 8% or 9%. The sales team reports that leads are not closing. Almost always, micro-conversions and soft engagements are being counted alongside genuine purchase-intent actions. The fix is a conversion audit first. Understand what is in your denominator before you react to the percentage.
Worth auditing your conversion rate setup at least once a year. Goals drift. The tracking tags that made sense at launch are not always what the business still needs to measure.
That number is only as meaningful as the definition sitting behind it.
What Actually Drives Your Conversion Rate
Most variables live outside the ad itself.
Careful SEO keyword research means your ads reach people with purchase intent already established. Broad or poorly scoped keywords pull in visitors at earlier stages of research. More irrelevant clicks. Lower rate on the same budget.
The click is just the entry point. What happens on the page determines the outcome.
Message match is the most common gap we find. Someone clicks an ad for “emergency HVAC Calgary.” They land on a general services page. No emergency mention above the fold. The phone number is buried. No reason to stay. That disconnect hurts your rate more consistently than almost any bid or targeting decision.
Load speed is the second most common culprit. A page that takes five or six seconds on mobile loses a significant portion of visitors before they reach the headline. Intent evaporates fast. Slow pages are not a technical problem in isolation. They are a revenue problem.
Businesses that pair the SEO work we do with paid campaigns often notice that pages optimised for organic ranking also convert paid traffic better. The disciplines overlap more than most advertisers expect. Organic ranking work builds the page quality that paid ads need to convert. The practitioner who handles both sees patterns that neither channel reveals alone. Organic traffic carries its own conversion rate, worth tracking separately from the paid number.

Your Landing Page Is the Rate-Limiter
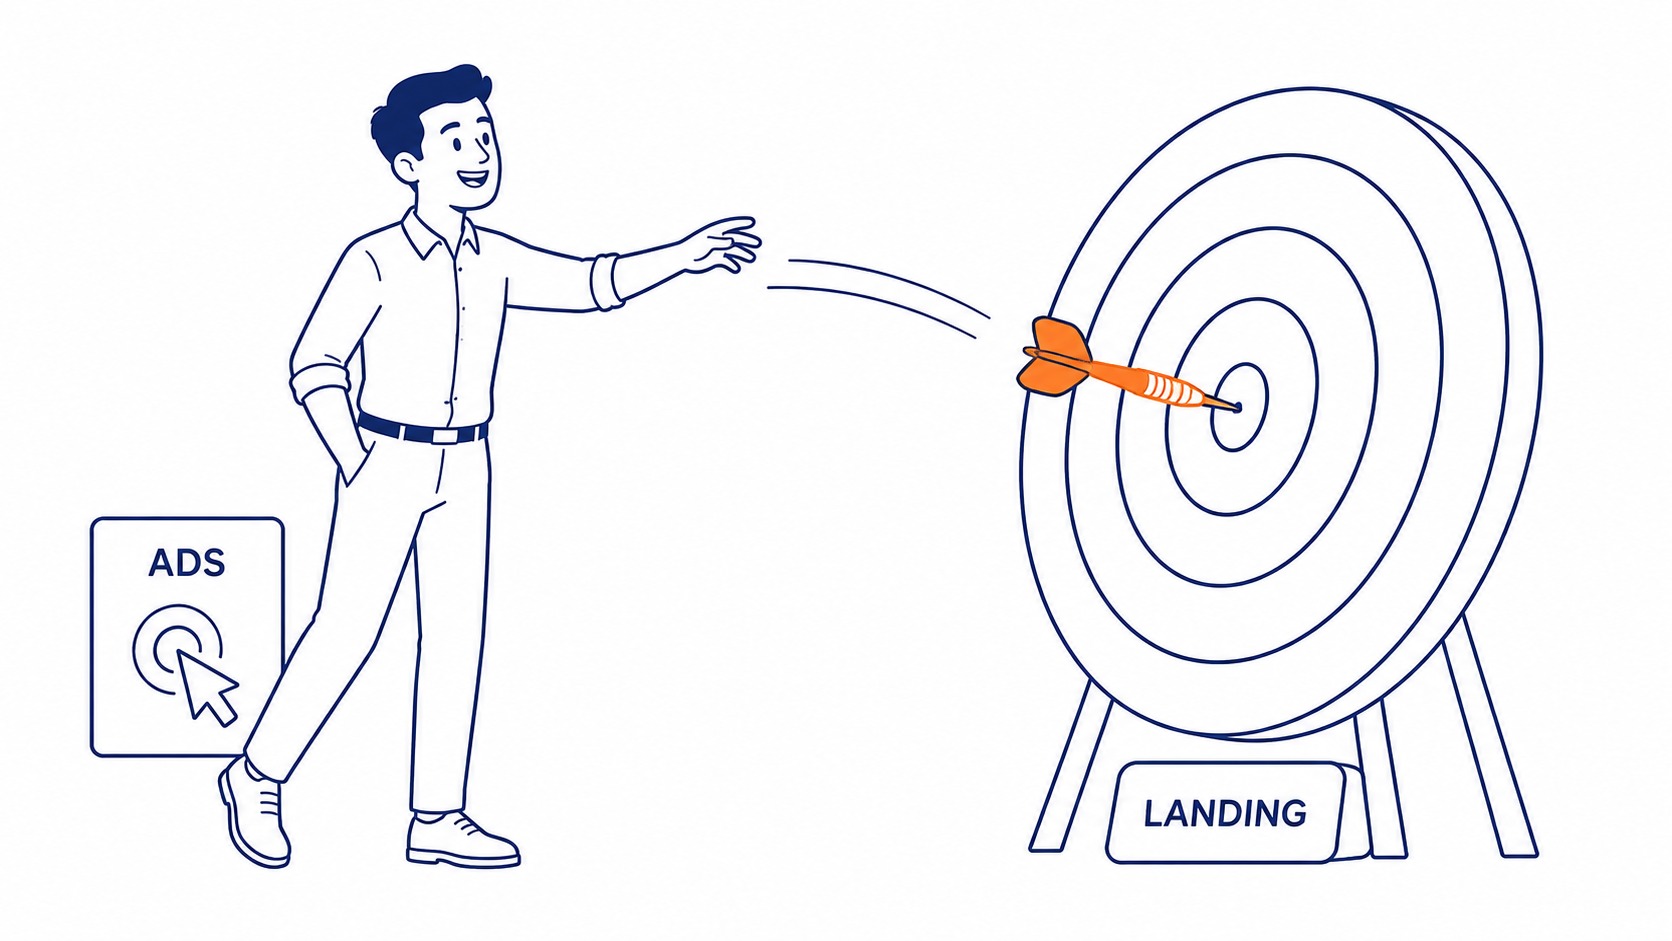
Ads earn the click. Pages earn the conversion.
Most paid search accounts we audit have adequate keyword targeting and reasonably relevant ad copy. Where the rate breaks down is on the landing page itself. The page is often the last thing anyone reviews when the numbers look flat.
Three issues repeat.
Forms with too many fields. Anything past name and phone adds friction. Every extra field costs conversions. Shorter forms convert at higher rates across almost every service category.
No visible next step above the fold. The visitor lands and sees the service described. No call-to-action visible before scrolling. The phone number is not in the header. They leave.
Generic pages for specific ad groups. A campaign with multiple service lines should not send every ad group to the same homepage. Each ad group benefits from a dedicated page matched to the intent of that keyword cluster.
In most cases, choosing to book a website audit surfaces more conversion opportunity than changing bids or rewriting ad copy. Worth doing before increasing spend.
How To Improve Your Google Ads Conversion Rate
Tested patterns, not theory.
Negative keywords are underused in most accounts we review. Adding negative keywords removes irrelevant search queries from your traffic mix. Fewer unqualified clicks means rates improve without touching a single ad or bid. One of the faster wins available.
Ad copy alignment matters. Your ad copy should mirror the specific query and the page headline. Disjointed flow between what someone searched and what they see on the page creates doubt. Doubt kills conversions before the visitor reads the offer.
Quality Score matters more than many advertisers realise. Google rewards relevant ads with better position at lower cost per click. Lower CPC means more budget working against your conversion target. More relevant traffic also converts at higher rates. The effects compound.
A/B testing your pages reveals what your actual audience responds to. Run two versions at the same time. Change one element. Headline copy. Form length. CTA wording. Each test adds something real to what you know.
If your account is not tracking all of the above, it may be time to have us manage your Google Ads — the problem usually traces upstream of the bids. Fix the foundation before adjusting spend. Adding budget to a campaign with message-match issues just spends more money reaching people who still leave without acting.
Calgary SEO and paid search work together more often than most advertisers plan for. Organic ranking data reveals which pages already convert organic visitors well. Those pages are often the strongest candidates for paid traffic too. Budget goes further on those pages, particularly with good CPC for Google Ads explained first.

Frequently Asked Questions
What is a good Google Ads conversion rate for a service business?
Service businesses on search ads typically see rates between 3% and 8%. Page quality drives most of that variance. So does how tight the keyword targeting is. An emergency plumber with a dedicated landing page and strong local keyword research can push above 10%. A general contractor sending traffic to a homepage with broad match keywords will likely sit closer to 1% or 2%. These are not fixed ceilings. Your conversion rate improves as your page and targeting tighten over time. The benchmark that matters most is your own historical average, improving month over month. An outside number does not tell you whether your specific account is working.
Is 5% a good Google Ads conversion rate?
For most service businesses running search ads, 5% is solid. It sits above the aggregate average of around 3.75%. Whether 5% is actually good depends on what you are counting as a conversion. Also on what each converted lead is worth. A 5% rate generating $50 leads is a very different situation from a 5% rate generating $5,000 clients. Rate tells you one dimension. Revenue tells you the full picture.
Why is my Google Ads conversion rate low?
Poor results usually trace back to a few places. Message mismatch between the ad and the page. Keywords pulling irrelevant traffic. A page that asks too much before the visitor trusts you. Or micro-conversions inflating the denominator with actions that are not genuine leads. A website audit often surfaces the problem faster than adjusting bids. Fix the page before you raise the budget.
Does a high CTR mean a high conversion rate?
Not necessarily. High click-through rate means your ad copy is compelling to the people who see it. Whether those people convert depends on the page and the offer. Keyword intent also needs to match what your business actually provides. We have seen accounts with strong CTR but weak results. Almost always a message-match problem. The click happened. But the page did not hold up its end.
Contact Calgary SEO Company To-The-TOP!
Questions about anything in this article, or about your own rankings? Talk to a Calgary SEO specialist directly.
Phone: (403) 308-5949
Address: 1509 14 Ave SW, Calgary, AB T3C 0W4
Hours:
Monday to Friday: 10:00 am – 7:00 pm
Saturday: 12:00 pm – 4:00 pm
Sunday: closed