How to Create an SEO Report
The first real SEO report I built for a client ran to 47 pages. Covered everything: page speed scores, crawl logs, thin content flags, backlink velocity charts. The client read it, sent a one-line reply: “Which three things should I actually do?” That question became the whole framework. The Calgary search marketing team at To-The-TOP! now spends more time deciding what to cut than what to add, which is the right instinct.
SEO reporting has one job. Show what the numbers mean and what to do next. A report that documents every available metric but offers no direction is a data dump. Clients stop reading those. Once a client stops reading the report, they stop seeing value in the work itself, and that is a retainer-ending problem.

What an SEO Report Actually Contains
Four sections cover 90% of what clients actually read: executive summary at the top, performance data in the middle, a technical SEO health snapshot, and a recommendations list at the close. Everything else is optional.

Executive summary first. Three to five sentences. What moved, by how much, and one line on why. Clients who read nothing else will read this. An executive without an SEO background still needs to understand whether the month was productive without opening a spreadsheet.
The performance section sits below it. Organic traffic from Google Analytics or GA4 is the core number: total organic sessions compared to the prior period and year-over-year. Below that, keyword rankings showing which terms gained or lost positions and where the largest movement happened. Then conversions, meaning how many of those organic visitors completed a goal: a form submission, a phone call, a purchase.
Technical health is its own block. A site health score pulled from a crawl tool, a count of resolved issues versus newly found ones, Core Web Vitals status. Keep it brief. Clients care about the trend line, not the raw crawl export.
Recommendations close the report. Three to five items, ranked by estimated impact. Specific enough to act on without a follow-up call.

Which Metrics Go In, Which Get Cut
Organic traffic and keyword rankings go into every report. Backlinks go in when link building is active. Conversions go in when tracking is set up and goals are defined. Domain authority scores add context when a client asks about competitive standing, but they are a slow-moving number and do not need monthly prominence.
Social signals, paid traffic performance, and page speed scores are easy to add and rarely drive decisions. If a client is not running ads, paid data is noise. Page speed matters for rankings, but a speed section belongs in a full-site health audit, not a standard monthly SEO report.
Keyword rankings go in, but the size matters. A keyword rankings table with 200 rows tells you nothing a ranked-by-movement top-20 table does not tell you better. Paired with strong keyword performance analysis, that top-20 list shows which terms are gaining traction and which need attention. That is the decision-making view.
Google Analytics handles engagement data: bounce rate, time on page, pages per session for organic visitors. Google Search Console provides the search-specific view: impressions, clicks, average position, and the queries actually driving traffic. Use both; they answer different questions.
What Bad SEO Reporting Costs
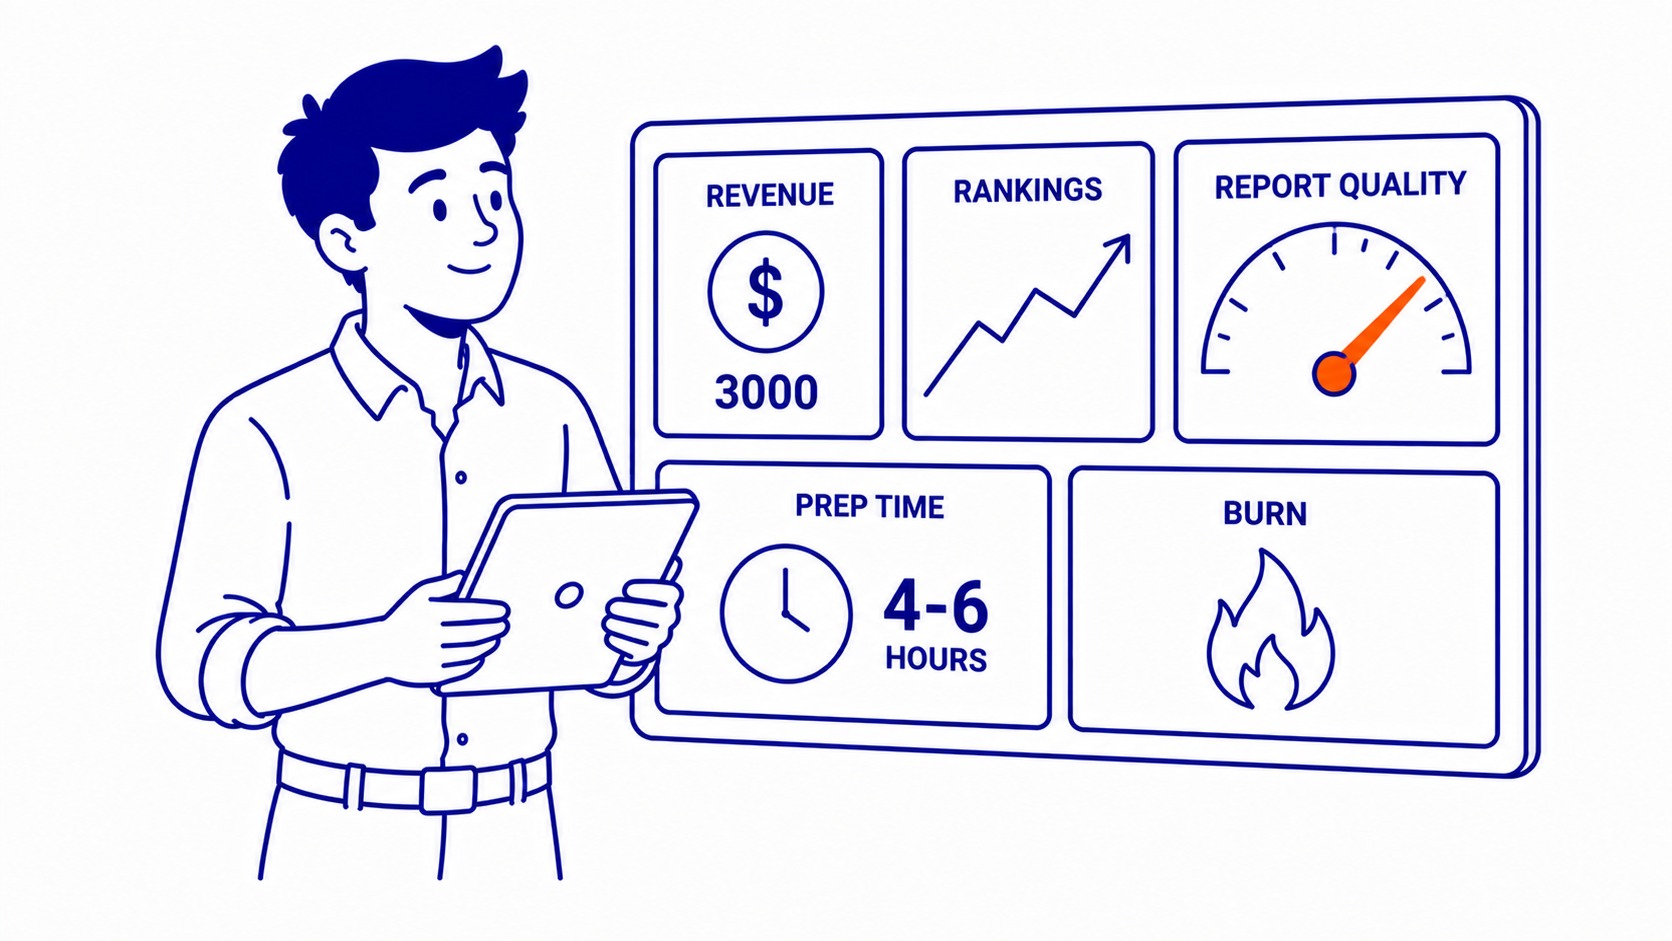
On a mid-size client doing $3,000 a month in SEO, poor reporting burns four to six hours of prep time every month on the agency side. That time goes into manually exporting spreadsheets, copying data between tools, reformatting. None of it shows up in the deliverable the client receives. Invisible waste.
The client side loses differently. A report that does not connect movement to action trains the client to stop reading. Once that happens, they stop seeing value in the engagement. A site health audit that surfaces a crawl error blocking 40 pages from indexing is worth nothing if the report buries it in appendix data the client never opens.
Organic traffic drops that sit unreported for six weeks cost rankings. Search Console shows the decline in impressions. A report reviewed monthly catches it within three weeks and triggers a fix. The same drop missed for six weeks means recovery takes three months, not three weeks. That gap is entirely preventable.
On the agency side, a report that does not clearly connect results to specific actions makes the renewal conversation harder. Showing that a Calgary search engine optimization strategy produced a 22% lift in organic traffic over six months is a retainable fact. That same 22% without attribution is just a number.
How to Build the Report Step by Step
Start with the data sources. Google Search Console, GA4, and one backlink tool such as Ahrefs or Semrush cover 80% of what any report needs. Connect them once. Every month the data is already populated.
Set the period first. Monthly reports compare to the prior month and to the same month a year earlier. Year-over-year matters most for seasonal businesses where month-over-month comparisons are misleading.
Pull organic traffic first. Sessions, click-through rate, impressions from Search Console. Note the top three pages by organic sessions. Flag any page that dropped more than 20% from the prior period. Those go on the recommendations list automatically.
Keyword rankings second. Which top-20 terms moved up more than three positions. Dropped terms get flagged. Any term that left the top 30 this month after ranking there last month is a priority. Four lines of data covers this for most clients.
Backlinks third. New referring domains added in the period, any lost referring domains, the net change. If no link building is active, this section is one paragraph, not a spreadsheet.
Write the recommendations last, but ranked by impact. Every recommendation needs a specific action: “Add internal links from the blog post published in week two to the service page targeting the primary keyword.” Not “improve internal linking.” Vague recommendations get ignored. Specific ones get checked off. Those checked-off items are the actual work, the same hands-on steps a guide on how to do SEO walks through.
For clients stepping into a proper SEO audit process for the first time, the first report takes longer because the benchmarks do not exist yet. That baseline becomes the reference point for every month that follows.
Tools That Automate the Work
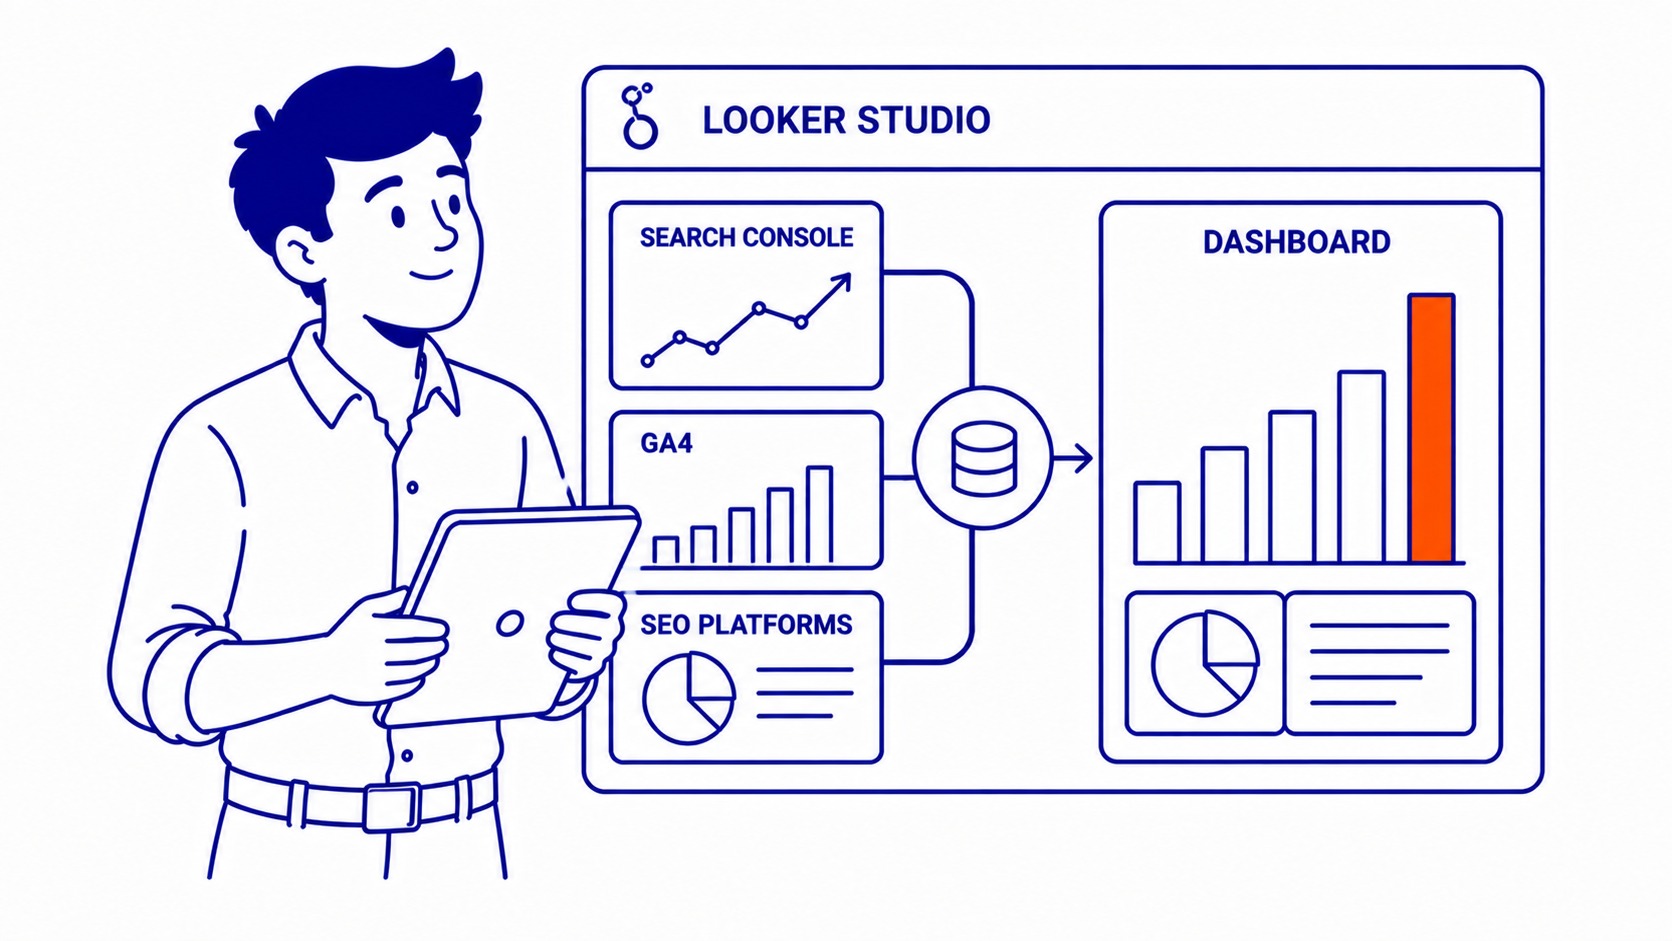
Google Looker Studio pulls from Search Console, GA4, and most SEO platforms simultaneously. Build the template once. Every month it auto-populates. A well-built Looker Studio dashboard cuts monthly reporting time from four hours to under an hour.
Ahrefs and Semrush generate client-facing reports with white-label formatting. Semrush’s My Reports tool adds scheduling: set the delivery date and it emails the PDF automatically. That removes calendar management entirely.
Screaming Frog runs on a schedule and exports crawl data to a spreadsheet. Feed that into the Looker Studio template and the technical health section compiles from the crawl output without manual entry.
Monthly SEO support that includes reporting does not require custom tools for every client. One template, one set of connected data sources, one send date. The work that takes time is interpreting the data and writing the recommendations. Automation handles the data collection. That is the right SEO reporting workflow.
Frequently Asked Questions
What is a SEO report?
A snapshot of a website’s search performance over a defined period. Organic traffic, keyword rankings, backlinks, technical health, and conversion data are the core metrics. Formatted so a business owner without an SEO background can read the executive summary and understand whether the strategy is working. The underlying data lives in Google Search Console, GA4, Ahrefs, or Semrush. Pull it together and that data becomes decisions.
How to get a SEO report?
Pull one from the tools you already have. Google Search Console exports a performance report in CSV. GA4 generates a traffic summary under the Acquisition tab. Ahrefs and Semrush produce formatted PDF reports from their dashboards. Working with an agency, monthly SEO reporting should be part of the retainer. Ask what data sources they pull from and how recommendations get prioritized before signing.
How do I see my SEO?
Google Search Console shows search performance directly: impressions, clicks, average position, and the queries driving each of them. Free and connected to actual Google search data. GA4 shows what visitors do after they land. Ahrefs or Semrush add backlink data and competitor keyword tracking. All three together give a complete read on organic performance without additional tools.
What does an SEO report look like?
One page of summary at the front. Two or three pages of charts and trend lines in the middle covering organic traffic, keyword movement, and backlink delta. One page of technical findings. Specific recommendations fill the last page. Formatted for a non-technical reader, with plain-language definitions on anything requiring SEO background to interpret. A report that needs a 30-minute explanation call was not built clearly enough.